Prepared for Herefordshire Voluntary Organisations Support Service by Adrian Taylor, 2026-10-05. If you work there and would rather this page came down, say so and it comes down.
Herefordshire Voluntary Organisations Support Service: what the records show, and what we could do together
Adrian Taylor runs Charity in a Box, after twenty years working in charities and public services. About Adrian.
1. What you say, and where we read it
We read your website (Welcome - HVOSS | Herefordshire Voluntary Organisations Support Service) and your public channels.
Your channels: x (closed to readers, not read); facebook (closed to readers, not read); instagram (closed to readers, not read).
2. Herefordshire’s charities, from outside
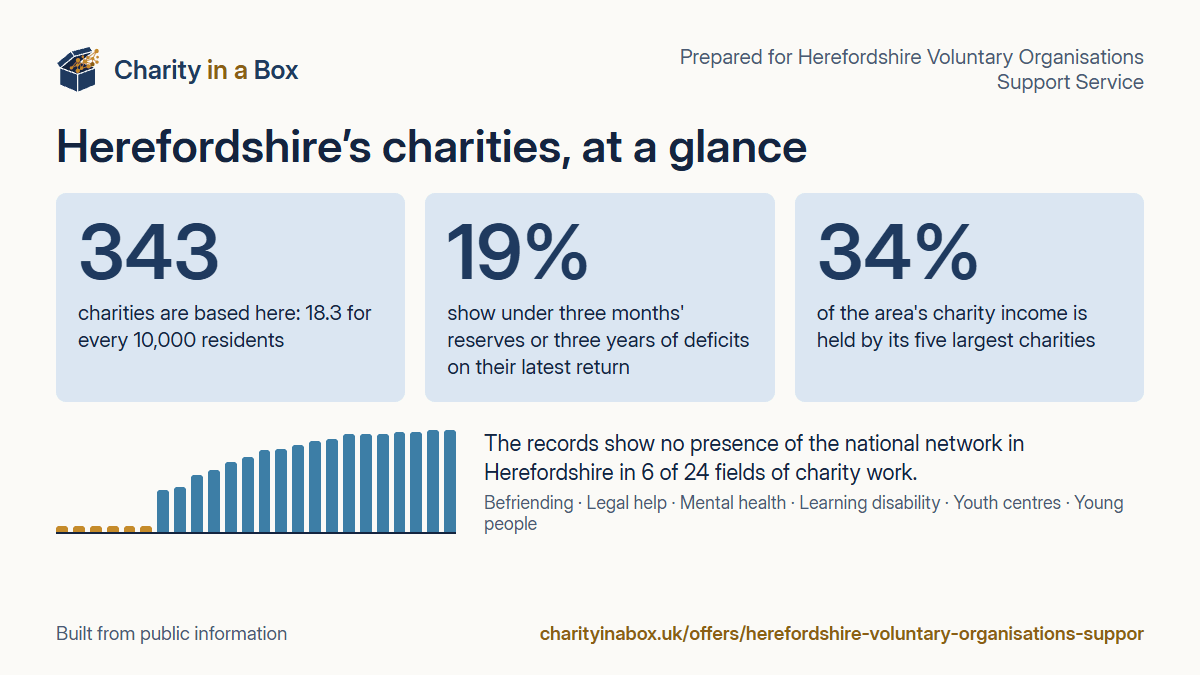
343 charities are based in Herefordshire, 18.3 for every 10,000 residents, where 18% of residents are on low incomes. 19% show under three months’ reserves or three years of deficits on their latest return; 7% take half or more of their income from government. The five largest hold 34% of the area’s charity income.
The 24 fields, against England
For each field of charity work we have mapped, where Herefordshire stands among England’s 152 areas for the presence of the national network per person in need. Gold bars are the fields where no presence is recorded here: 6 of 24.
Befriending
Legal help
Mental health
Learning disability
Youth centres
Young people
Hospice care
Local infrastructure
Unpaid carers
Rural communities
Older people living alone
Veterans
Dyslexia
Community foundations
Disability services
Drug and alcohol services
Community transport
Cadets
Kidney patients
Young people with SEND
Families with young children
Almshouses
Food aid
Riding for the disabled
Herefordshire: the bar is where the area stands among England's 152 areasnone recorded here, or in the thinnest fifthEngland's median area
Point at a bar for its figures.
Who does the work here, by register purpose
Herefordshire343 charities
Education/training168
General charitable purposes94
Religious activities72
Arts, culture, heritage, sci…71
Disability61
Poverty relief57
Health56
Economic/community developme…49
Environment48
Amateur sport40
Recreation33
Other purposes31
A charity records up to three purposes, so the circles overlap. Point at one for its count.
Researchers who studied how charities support people with dementia across the United Kingdom concluded:
“National and local data sources could help charities and commissioners begin to identify inequalities of provision.”
Mayrhofer, Goodman, Lafortune, Smeeton, Littlechild, Shora and Bunn, Voluntary Sector Review, first published 2021. Read the paper.
This page is that view for Herefordshire.
3. Sample campaign
Three posts in your voice from the figures above, each with its picture, ready to use. Every figure is from public information and no charity is named.
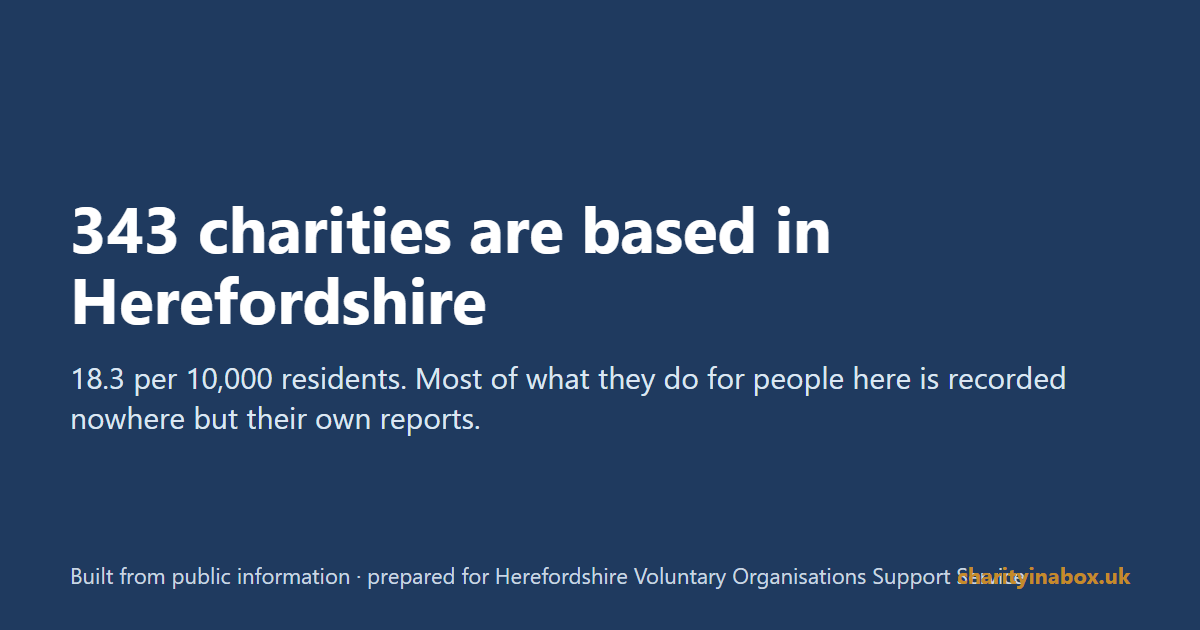
Bluesky / X: 343 charities are based in Herefordshire: 18.3 for every 10,000 residents. We've read what they say they do. https://www.charityinabox.uk/offers/herefordshire-voluntary-organisations-support-service.html
LinkedIn: 343 charities are based in Herefordshire: 18.3 for every 10,000 residents. We've read what they say they do. https://www.charityinabox.uk/offers/herefordshire-voluntary-organisations-support-service.html
Built from public information; no charity is named.
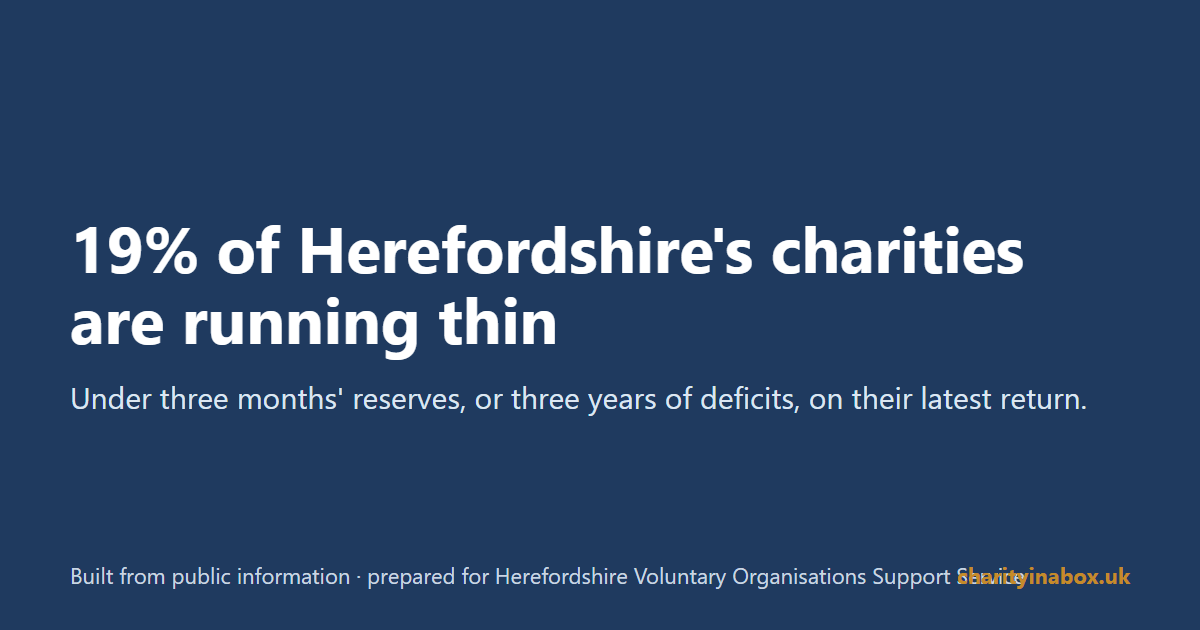
Bluesky / X: 19% of Herefordshire's charities show under three months' reserves or three years of deficits on their latest return. Which fields, and who else is at work: https://www.charityinabox.uk/offers/herefordshire-voluntary-organisations-support-service.html
LinkedIn: 19% of Herefordshire's charities show under three months' reserves or three years of deficits on their latest return. Which fields, and who else is at work: https://www.charityinabox.uk/offers/herefordshire-voluntary-organisations-support-service.html
Built from public information; no charity is named.
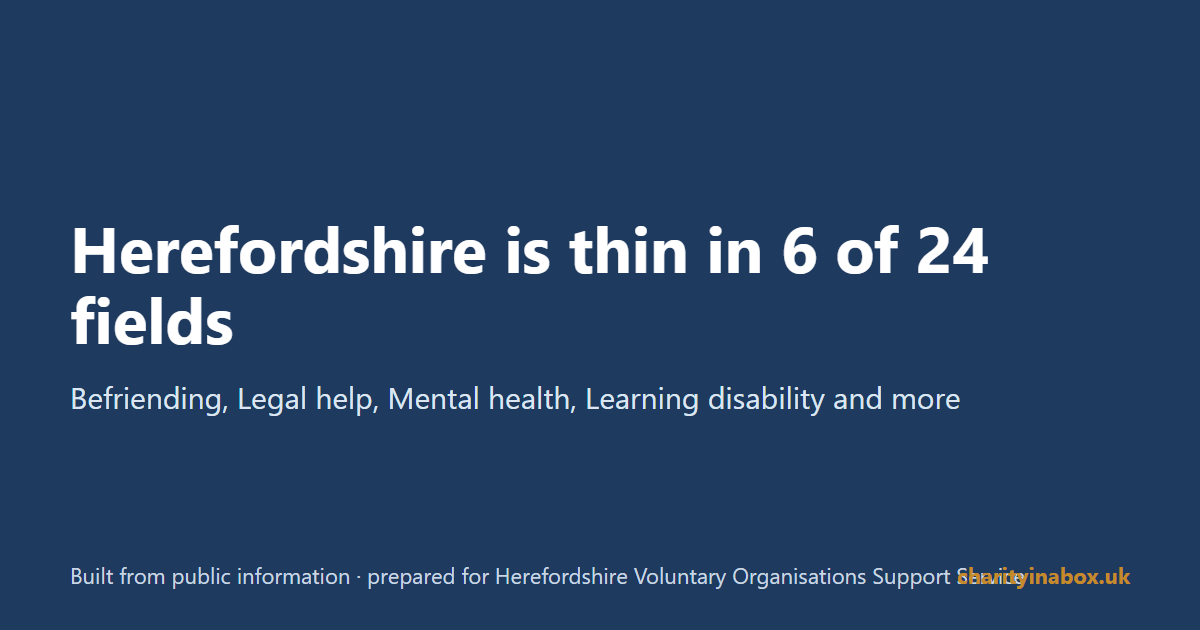
Bluesky / X: Across 24 fields of charity work, the national network has little or no presence in Herefordshire in 6 of them: befriending, legal help, mental health. https://www.charityinabox.uk/offers/herefordshire-voluntary-organisations-support-service.html
LinkedIn: Across 24 fields of charity work, the national network has little or no presence in Herefordshire in 6 of them: befriending, legal help, mental health. https://www.charityinabox.uk/offers/herefordshire-voluntary-organisations-support-service.html
Built from public information; no charity is named.
Your area's charities from outside: how many, how exposed, which fields of charity work are thin here, who else does the work the known networks don't, what the money looks like, the year-on-year change. A page like this one, in full, refreshed each quarter as the new reports arrive.
£600 once, or £1,200 a year with four refreshes
The members' view
The same page for each of your member organisations' fields, so a member sees where it stands beside the rest of its field in your area.
from £1,500 a year, by your income band
A campaign from the findings
Three to five posts a month in your voice, each with its picture, from your area's own figures.
£250 a month
The first month: a twenty-minute call, your page in full within a week, and the first campaign posts the week after. Prices are set by income band from the public register and are the same for everyone in the band.
5. How to say yes
Reply to the email with a day that suits, call or text Adrian on the number in the email (it is on the Contact page too), or write to adrian@charityinabox.uk.
What this can and cannot say. These are counts over groups of charities and places from their own returns and reports and from national statistics. They do not rank any charity, name any, or say why. A thin field is one where the known network is thin for the people counted here, not one where nobody is helped.
Built from public information: the Charity Commission for England and Wales register and the annual reports charities file with it (OGL v3.0); Census 2021 (ONS); the English Indices of Deprivation 2025 (MHCLG); the Claimant Count (ONS). Privacy.